心電圖解密:獸醫心臟節律指南 – 第一部分:心臟的電氣藍圖
預計閱讀時間:4 分鐘
歡迎閱讀我們新系列文章 《心電圖解密:獸醫心臟節律指南》(The ECG Decoded: A Veterinarian’s Guide to the Heart’s Rhythm) 的第一期。在接下來的幾期中,我們將把心電圖 (ECG) 的複雜性分解為實用、可操作的知識,供您在日常診療中應用。
每一次出色的判讀都始於堅實的基礎。在我們能夠診斷異常之前,必須深入了解正常狀態。本文將探討心臟內在的電氣系統 (Electrical System) —這是您將在心電圖 (ECG) 上看到的每一個複雜、簡單、良性或危急節律的根源。
心臟的內建節律器 (Pacemaker):傳導系統 (Conduction System)
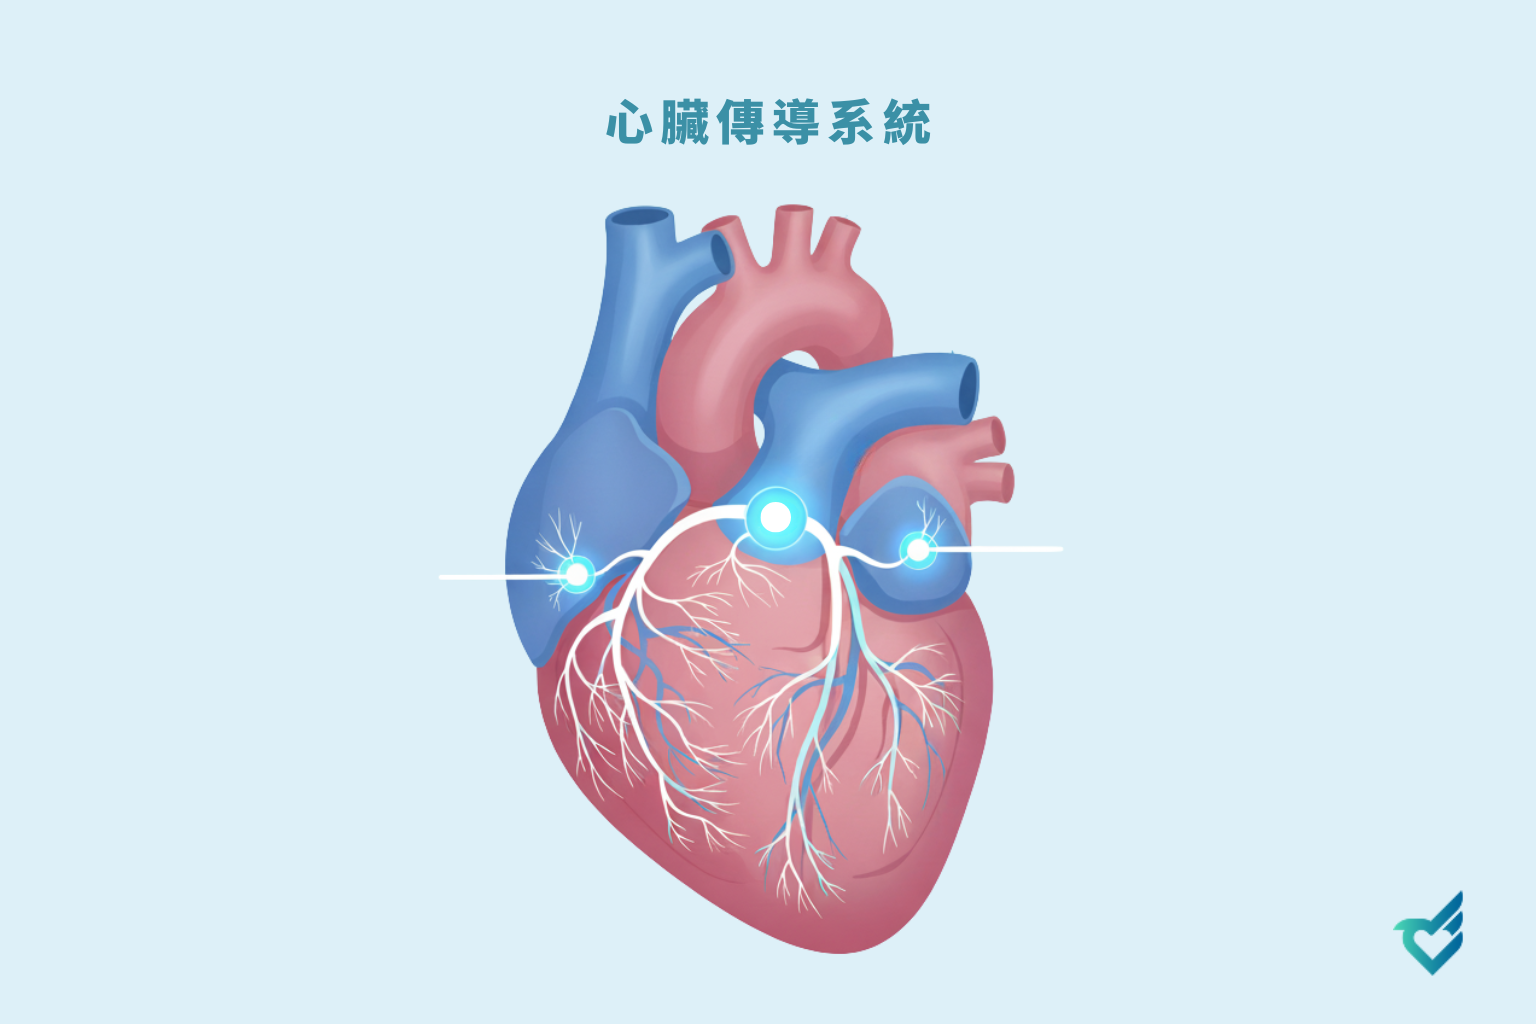
將心臟的傳導系統視為一個精密的內建電氣網絡。它確保心房 (Atria) 和心室 (Ventricles) 以協調、同步的方式收縮,以最大化泵血效率。該系統由能夠自動產生並快速傳導電脈衝 (Electrical Impulses) 的特殊細胞組成。
按激活順序排列,關鍵結構包括:
- 竇房結 (Sinoatrial Node, SA Node): 心臟的天然節律器。位於右心房 (Right Atrium),它以規律的速率自動發出電脈衝,啟動每一次心跳。這設定了“竇性節律 (Sinus Rhythm)”。
- 房室結 (Atrioventricular Node, AV Node): 充當守門員的角色。位於心房和心室之間,它會暫停延遲電脈衝。這個關鍵的停頓讓心房 能夠完成收縮並將血液充滿心室,然後心室才開始收縮。
- 希氏束 (Bundle of His) 與束支 (Bundle Branches): 這條路徑攜帶脈衝從房室結 通過室間隔 (Interventricular Septum),分裂成右束支 (Right Bundle Branch) 和左束支 (Left Bundle Branch),以同時將信號傳遞到兩個心室。
- 浦金耶纖維 (Purkinje Fibers): 一個精細的纖維網絡,能將電波迅速傳遍心室肌肉,從而產生同步、有力的收縮,將血液泵出心臟。
當這個系統功能正常時,就會產生我們所追求的高效、有節奏的“撲通-咚”聲。
生命的火花:心臟電生理學 (Cardiac Electrophysiology)
但“發出脈衝”到底是什麼意思?這一切都歸結於電生理學 (Electrophysiology) 的基本原理:離子 (Ions)(如鈉 Sodium、鉀 Potassium、鈣 Calcium)跨心臟細胞 (Cardiac Cells) 膜的運動。
這個過程創造了一系列的電氣變化,稱為去極化 (Depolarization)(心臟細胞的觸發或激活)和再極化 (Repolarization)(重置或恢復階段)。
- 去極化 是電激活波掃過心臟肌肉,觸發機械性收縮 (Mechanical Contraction) 的過程。它是導致肌肉“擠壓”的“火花”。
- 再極化 是細胞重置至其靜息狀態的必要恢復期,為下一個脈衝做準備。
這種通過傳導系統的去極化和再極化的協調波,就是心電圖機檢測到的電氣活動。
心電圖的生成 (Genesis of the ECG):將電氣轉化為圖形 (Tracing)
那麼,這種無形的電氣活動如何變成心電圖圖形上熟悉的彎曲波形線呢?心電圖是對心臟電氣力量的表面測量。放置在皮膚上的電極會檢測這些電波在心臟中傳播時的累積強度和方向。
熟悉的 P-QRS-T 複合波 (P-QRS-T Complex) 中的每個組成部分都直接對應一個特定的電氣事件:
- P 波: 代表心房去極化 。它是從竇房結通過兩個心房 傳播的脈衝 的電氣特徵。
- QRS 複合波: 代表心室去極化。這是強大的電波通過束支 (Bundle Branches) 和浦金耶纖維 (Purkinje Network) 快速移動,導致主要心室 收縮。心房在此時正在進行再極化,但該信號被更強大的心室活動所掩蓋。
- T 波 : 代表心室再極化 。這是心室在電氣上進行自我重置,為下一個週期做準備。
這些波之間的平坦段(例如 PR 段 和 ST 段)是關鍵時期,分別代表房室結的延遲和心室激活 (Ventricular Activation) 的平台期 (Plateau Phase)。
為什麼這個基礎對您的診療至關重要
理解這個電氣藍圖 (Electrical Blueprint) 是超越模式識別 (Pattern Recognition)、進入真正節律判讀 (Rhythm Interpretation) 的關鍵。當您看到一個奇怪的複合波時,您可以提出正確的問題:這是源自心房 還是心室 ?傳導系統 是否完整?房室結是否在履行其職責?
在 CardioBird,我們熱衷於將這些深層的、基礎的科學轉化為您日常使用的實用工具。我們的人工智慧 (AI) 不僅僅是識別模式 (Patterns);它是基於對這種電生理學 (Electrophysiology) 的深刻理解而構建的。通過分享這些知識,我們希望不僅能讓您信任 AI 的分析,還能深化您自身的專業知識,提升您為每位患者提供的照護水準。
請期待我們的下一期,我們將在此基礎上,進一步闡明心電圖波的形成與判讀、正常竇性節律 (Normal Sinus Rhythms) 和心率變異性 (Heart Rate Variability)。
CardioBird 團隊 敬上